Along with NAV analysis, comparing oil & gas producers on a variety of near-term trading metrics (that utilize the prevailing market price of a company’s shares) can allow an investor to determine whether a stock has a favourable or unfavourable relative valuation versus its peers.
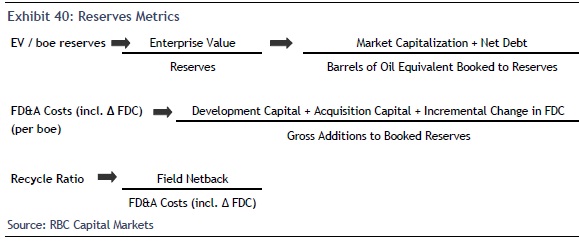
Some of the most common multiples include cash flow (Exhibit 38), production (Exhibit 39), and reserves (Exhibit 40) metrics.
The above cash flow metrics attempt to answer the question “How much are you paying per dollar of cash flow generated by the company’s day to day operations?” The difference between the two is the effect of debt outstanding on a company’s balance sheet (i.e., “leverage”). Using EV/DACF vs. P/CFPS results in a “debt neutral” comparison between companies, allowing for a cleaner comparison between their cash-generating operations, regardless of capital structure.
Enterprise Value per Flowing Barrel (EV / boe/d) attempts to answer the question “How much are you paying per barrel of existing production?” That is, how expensive is the company with respect to its current upstream operations? It is important to understand why the market might be assigning a high multiple to a particular company before assuming that it is simply overpriced – is production weighted to oil? If so, the associated revenue and gross profit will be higher if the prevailing oil price environment is stronger than the natural gas market. Are production volumes about to grow? The market is forward-looking: if investors are aware of an event that will cause production to increase significantly (reducing the future multiple), they may be willing to pay now for that growth.
Field Netback shows an investor the take-away or “keep” – i.e., How much margin is generated from a produced barrel after standard costs are factored in? It attempts to indicate asset profitability before factoring in corporate items such as G&A expense, interest and cash taxes.
Enterprise Value-to–Reserves (EV/boe) attempts to answer the question “How much are you paying per barrel of booked reserves?” or “How much are you paying per barrel still in the ground?” The majority of an upstream producer’s value resides in the future potential of its oil & gas assets, and investors may be willing to pay more for a “future barrel” in some cases (i.e., if the reserves are oil-weighted). Again, in the case of a strong oil environment vs. a weak natural gas market, oil-weighted reserves should result in comparatively higher future revenue and gross profit. If the majority of booked reserves are classified as PDP (proved developed producing), it’s likely that the future cost to bring them onto production is lower than with other classifications of reserves.
Finding, Development & Acquisition (FD&A) costs demonstrate the cost associated with identifying a barrel of reserves and bringing it on production. Reserves can be found organically (i.e., on the company’s existing asset base) or they can be bought (i.e., a company acquires an asset with reserves from another producer). Either way, the result is an addition to the reserves book which comes at an expense, and this metric attempts to demonstrate that cost. The incremental change in undiscounted future development capital (FDC) is included to equalize the metric with respect to the classification of reserves added. If all of the added reserves are categorized as “probable” then the risk and cost associated with developing those reserves is likely higher than reserves added to the PDP category.
The Recycle Ratio indicates the level of profitability of an oil or gas asset (i.e., field profit per barrel as a multiple of the cost to find and develop that barrel). When choosing between assets for development, those with higher recycle ratios are likely to be favoured due to higher associated returns.


